Tuesday, 22 December 2009

Immersion in history - 1

One obvious aspect of chronographics is that they are designed to provide overview or perspective – to produce an objectivising effect. Priestley wrote:
TIME is continually suggested to us, by the view of this chart, under the idea of a river, flowing uniformly on, without beginning or end. [...] IF we compare the lives of men with that portion of it which this chart represents, they are little more than so many small straws swimming on the surface of this immense river, strongly expressing the admirable propriety of those lines of Dr. Watts, concerning the eternity of GOD.
While, like a tide, our minutes flow,
The present and the past ;
HE fills his own eternal NOW.
And sees our ages waste.
Priestley, Joseph. 1764. Description of a Chart of Biography. J. Johnson, London. p26.

A less obvious potentiality is to create a sense of immersion in the moment. Priestley described it like this:
IT is a peculiar kind of pleasure we receive, from such a view as this chart exhibits, of a great man, such as Sir Isaac Newton, seated, as it were, in the circle of his friends and illustrious cotemporaries. We see at once with whom he was capable of holding conversation, and in a manner (from the distinct view of their respective ages) upon what terms they might converse.
Op cit. p24.

This is one of the strongest features of the Machine Chronographique of Barbeu-Dubourg. He writes of his invention as...
...a moving, living tableau, through which pass in review all the ages of the world, where each famous figure steps forth in his rank with the attributes belonging to him, where each Prince is surrounded by his contemporaries and occupies the scene for more or less time according to the duration of his role, where the rise and fall of Empires are acted out in visible form...
Barbeu-Dubourg, Jacques. 1753. Chronographie, ou description des temps…. Paris. Photocopy in the Rare Books Collection, Princeton University Library, from an original of the explanatory booklet for the chart (q.v.) in the Bibliothèque Nationale, Paris. Princeton University Library call number: D11 .B372 1753a. p8
And again...
Do you wish to look next through the entire Chart? First you find God alone before all time; then you see Adam appear, and at once the sequence of the centuries, in which all the years are marked out...
Op cit. p13

Here the sense of history as immersive experience is uppermost. More on this in future posts.

Representing uncertainty

One of the weaknesses of most chronographics is that they conceal uncertainty. This was the case with the first modern timeline, the Carte Chronographique of Barbeu-Dubourg, but not the second, Priestley’s Chart of Biography. Priestley wrote:
It is an imperfection which must necessarily attend every chart of this nature, that the time of the death but more especially the time of the birth of eminent men cannot always be found. In this case the compiler must content himself with placing his line as near as he can conjecture from history where his true place was, leaving marks to express the uncertainty there is attending it.
Priestley, Joseph. 1764. Description of a Chart of Biography. J. Johnson, London. p11.
Priestley’s references to uncertainty can be seen in the copy of his Description on Google Books.

It is increasingly recognised that visualisations need to represent uncertainty effectively. 
Scientific data from instruments, numerical models, or interpolation schemes almost invariably contain some degree of error or uncertainty. Display of such scientific data without uncertainty information is incomplete and may lead to erroneous conclusions. Visualization of data with uncertainty information allows more accurate and effective interpretation.
Wittenbrink, C.M., Pang, A.T. and Lodha, S.K. 1996. Glyphs for Visualizing Uncertainty in Vector Fields. IEEE Transactions on Visualization and Computer Graphics 2(3). September 1996.


Priestley, Joseph. 1765. A Chart of Biography. Photo: Stephen Boyd Davis. With the permission of Chetham's Library, Manchester. 
Priestley not only recognised the problem but devised an effective solution within the limits of the available technology. Minor uncertainty is expressed by a dot underneath the end of the lifeline in question. Increasing levels of uncertainty are expressed by replacing the end of the lifeline with between one and three dots. The illustration above includes three examples which are all dots.

Based on a classification of forms of uncertainty suggested by Pham, Streit and Brown (2009), I have itemised some of the uncertainties that might need to be represented in a timeline for today:
  • Range of precision: might range from centuries to seconds.
  • Dates which are unknown
  • Dates which are uncertain with various levels of uncertainty.
  • Dates of inherently fuzzy events such as movements, trends, ‘-isms’ etc.
  • Multiple sources: conflicting evidence of dates
  • Multiple models: conflicting calendars (Julian, Gregorian, Islamic, Jewish, Buddhist etc).
  • Membership of sets prone to views of different experts. Dispute over categories.
  • Sets worthy of modelling contested (Priestley acknowledged that his set is dominated by the English and that it would have been different if designed for a different public).
  • Need to be able to import existing datasets which may be inadequate in many, perhaps unpredictable, ways.
References
  • Pham, B., Streit, A. and Brown, R. Visualisation of Information Uncertainty: Progress and Challenges. In: Zudilova-Seinstra, E., Adriaansen, T. and van Liere, R. (eds.) Trends in Interactive Visualization. Springer, London. 2009. 19-48 
  • Priestley, Joseph. 1764. Description of a Chart of Biography. J. Johnson, London. 
  • Wittenbrink, C.M., Pang, A.T. and Lodha, S.K. 1996. Glyphs for Visualizing Uncertainty in Vector Fields. IEEE Transactions on Visualization and Computer Graphics 2(3). September 1996.

Monday, 21 December 2009

Lorenzo da Ponte, ungleichzeitigkeit, chronographics

Some possible translations of the German ungleichzeitigkeit include:
    not-happening-synchronously-ness
    asynchronicity
    nonsynchronism
    temporal disphasure
    historical misalignment
    temporal asymmetry

According to the article in the German version of Wikipedia – here freely translated – ‘Ungleichzeitigkeit is a term coined by the philosopher Ernst Bloch in Heritage of our Times (Zurich, 1935) which in the social sciences and history is associated with classical modernism of the 19th and 20th Century.’
Portrait of Lorenzo da Ponte by Samuel B Morse.

Portrait of Lorenzo da Ponte by Samuel B Morse. From http://www.schillerinstitute.org/educ/hist/daponte.html

In that book, Bloch begins the chapter translated by Ritter as Nonsynchronism and the Obligation to Its Dialectics with the statement ‘Not all people exist in the same Now.’ From a political stance, he identifies the way in which groups in society belong to cultural clusters which do not share a single zeitgeist.

The term has been adopted by some to denote the more general sense of an apparent misalignment of events belonging to contemporaneous cultural groups. For example in In Search of a Nineteenth Century, Jürgen Osterhammel of the University of Konstanz refers to ‘minor and major, personal and structural survivals and Ungleichzeitigkeiten, made visible by historical cross-sectioning.’ At this point I hope the relevance to chronographics – and especially synchronographics, which aim to show synchronous events across cultures, countries and categories – becomes clear. Osterhammel suggests that ‘Cutting through the tissue of history at any given time allows startling insights into the much-quoted “simultaneity of the nonsimultaneous”.’

Osterhammel gives as an example his investigation of the year 1837 (‘Year One of the Victorian Age’) in which he found Samuel Morse taking out a patent on the telegraph while at the same time Lorenzo da Ponte, Mozart’s librettist, was still alive and well and living in New York. Remarkably, Osterhammel does not note that there is a portrait which encapsulates this particular ungleichzeitigkeit, a painting of da Ponte, by Morse - who was more an artist than he was an inventor, with a self-appointed mission to introduce European culture to the States (see Gere 2006: Chapter 2). The existence of the painting is noted in Susan W. Bowen’s review of a book by Rodney Bolt published in 2006, and earlier in an article in 2000 by Jeremy Sams in the Independent newspaper.

The painting was first brought to my attention by the artist Nat Goodden when he was a postgraduate student at the Lansdown Centre in 1993-95. He showed me a photocopy of the portrait and asked me what it was – I was astonished. Nat has continued to pursue these themes, including in a prototype website to explore such cross-connections: http://culturalcartography.net/what. There he writes ‘what took my breath away was to realise that this early pioneer of the digital age had crossed paths with the man who wrote the words for The Marriage of Figaro, Don Giovanni, and Cosí Fan Tutte: I’d have thought of them as belonging to two entirely different times, places and cultural milieux.‘ I believe I can trace my own obsession with chronographics to that conversation – thank you, Nat.

References

Bowen, Susan W. 2006. Anathema of Venice: Lorenzo Da Ponte: Mozart’s American Librettist a review of Bolt, Rodney. 2006. The Librettist of Venice; The Remarkable Life of Lorenzo Da Ponte; Mozart’s Poet, Casanova’s Friend, and Italian Opera’s Impresario in America.

Bloch, Ernst. 1977. (trans. Mark Ritter) Nonsynchronism and the Obligation to Its Dialectics. New German Critique 11 (Spring, 1977). 22-38. Available as a PDF file (400K).

Gere, Charlie. 2006. Art, Time and Technology. Berg, Oxford.

Heartz, Daniel. 1995. Mozart and Da Ponte. The Musical Quarterly 79(4) (Winter, 1995). 700-718. Available through JSTOR: subscription required.

Osterhammel, Jürgen. 2002. In Search of a Nineteenth Century. Sixteenth Annual Lecture of the German Historical Institute, 14 November 2002. Available as a PDF file (112K).

Sams, Jeremy. Lorenzo the magnificent. The Independent. Tuesday 16 May 2000.

Friday, 4 December 2009

Important new book

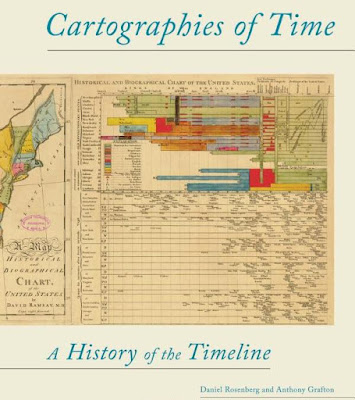
Cover of book Cartographies of Time


An important book is about to come out on the history of timelines by two key authorities in the field. The publishers say:
Cartographies of Time is the first comprehensive history of graphic representations of time in Europe and the United States from 1450 to the present. Authors Daniel Rosenberg and Anthony Grafton have crafted a lively history featuring fanciful characters and unexpected twists and turns.
See the book on the publisher’s site.